Friday, April 29, 2016

The $100,000 Challenge: March Update

march update


We finally finished the last month of the $100,000 challenge. March was an awesome month for Nutrition Secrets. Not only did the traffic grow to 218,811 visitors, but revenue did too-it went up to $121,492.65.


It wasn't hard to hit the revenue goals as we had enough fish oil in stock, plus we started to generate money from affiliate sales.


So let's dive right in…


Traffic


Compared to February, the traffic went up to 218,811 visitors and 269,814 pageviews. The increase was only 18,102, which isn't much.


But considering that the popularity of nutrition and fitness sites is cyclical (January and February are most popular) and that Mike didn't blog much on NutritionSecrets.com in March, it wasn't too bad.


Overall, Mike has slowed down on the blogging front. Over the next few months, he wants to try a few fun content formats such as infographics and wants to see what happens if we were to dump a few hundred grand into the blog. It won't be much of an experiment at that point, but we are just curious to see if we can get the blog to a million visitors a month.


traffic sources


Nonetheless, the traffic isn't performing too badly. Even in April, the traffic has been on an upward trend while little to no effort has been put into the blog since the challenge has been over.


Revenue


The revenue is a bit more complicated to breakdown as it is coming from two sources now: Amazon and affiliates.


In March, revenue from Amazon hit $112,573.30.


amazon revenue


There are a few key elements to growing Amazon sales:


  1. Reviews – the more people you can get to leave a review, the better off you are. Most people don't even read the reviews, but if they are high in ratings and you have tons in quantity, you are in good shape. If you have a blog that's driving sales, a great way to get more reviews is through marketing automation. You can promote the product to your email list, and then after a few weeks of promoting your product to those people, you would send an automated email asking them to leave a review. You won't really know who bought the product, but you would still put the review email-applicable to a portion of your list-in your sequence.

  2. Keywords – with Amazon, you can add keywords. Most people add basic ones like “fish oil,” but as you know, it is all about the long tail. Amazon opened it up so you can stuff hundreds of keywords now, and with the use of Google Keyword Planner, you can come up with popular variations. You'll then start ranking for tons of keywords on Amazon.

  3. Combating negative Amazon reviews – similarly to what happens when people employ negative SEO, competitors sabotage your Amazon listing by taking up your front page with terrible reviews. They do this to tank your sales so they can generate more income. You fight this by building up your email list on your blog and continually blasting out to your list when you have bad reviews, asking your readers to up-vote the positive ones.

  4. Ads – Amazon allows ads on its platform. Whether it is profitable or not, ads help you generate more sales. And if you can increase your sales velocity, you'll find that your listing climbs up higher and starts to stick-it stays up there even after your ads stop showing. Sure, other people can do the same thing, but most don't.


As for affiliate income, we started to push stuff by the Truth About Abs guys. We started doing email blasts to our list in order to generate the sales, and it has been working out well. The copy isn't too bad, but there are two reasons it's working out well.


aweber


  1. We collect a lot more emails – we are generating 300 to 400 email sign-ups a day. It's much larger than our previous numbers for one reason: we turned off double opt-in. Aweber usually requires double opt-in when you use third-party software to collect emails, but Mike called Aweber and got them to disable double opt-ins.

  2. Good copy – our copy converts well. You can see an example email below. And we have many more emails like this in the sequence. So, we continually send you affiliate offers over time, which helps.


Here is the email copy we have been testing:


Email – This plant food HARMS your metabolism & heart


Hi {!firstname_fix}


Sometimes it's not the enemy you know that's the problem, but the friend you think you know.


In this case, I'm talking about nutrition in foods. It's common knowledge that stuff like sugary drinks are just plain bad for you. The best you can say is that your body can absorb the bad effects if you only have them occasionally.


But what about foods you thought weren't bad, and you heard were actually good for you?


I have some bad news, and some good news. The bad: some so-called “healthy” foods may be the cause of why you work so hard to eat healthy and haven't seen the results you expected. The good news: There's a solution I read about from best selling author Mike Geary.  Read on… (removed affiliate link)


Email – 2 Simple steps to REMOVE visceral belly fat (the DEADLIEST type)


Hi {!firstname_fix}


People often refer to past times as “the good old days” with a nostalgic tone. At least when it comes to many nutritional and health practices, I think of them more like the “bad old days.”


For example, people thought the wonders of science had delivered new, healthy products called “trans fats” that were featured in margarine, to replace that nasty butter. We now know that trans fats are about the worst thing you can coat your innards with.


People also thought they could do “spot reducing” of unattractive belly fat by using those jiggling-belt machines, or some other gimmick.


Well, belly fat certainly is still unattractive, and research says it's also a danger sign. But research has also identified more-effective ways of getting rid of that spare tire. Here's how. (removed affiliate link)


Email – 7 “fatty” foods for a flat stomach


Hi {!firstname_fix}


I spend full time on nutrition- and health-related activities. That's the business I'm in.


I'm also an improvement junkie, always looking for the latest, best information. So you can imagine that I've pretty much seen it all: Every product, every supplement, every type of exercise.


Most of them are underwhelming. Yawn.


I'm writing you today because I recently came across something that made me sit up and pay attention. It's a short-term blueprint for eating the right foods to burn substantial fat, and it's all explained here… (removed affiliate link)


You can find high converting offers on sites such as Clickbank. They even sort the offers by popularity. I need to get a screenshot of our Clickbank revenue and our other affiliate income sources from Mike as he created the accounts and has the logins. Once I do, I will update the post with a screenshot (we use three networks).


The total affiliate revenue was $8,919.35.


Profit


As for monthly profit, it was high…but for a different reason than you might think. When you sell tangible products, you buy tons of inventory and then sell it over the following few months. We didn't want to be out for our last month, so we spent a good chunk of money in the previous month, and, of course, we bought more in March.


Here is a breakdown of the expenses:


  • Fish oil – $68,492.52 (including Amazon fees, shipping to Amazon for Prime, coupon-related expenses, and producing more inventory)

  • Aweber – $149

  • Designer – $375 (continually tweaking the site)

  • Hosting – $249

  • Mike – free (Mike doesn't get paid, but he owns a percentage of the blog)

  • Accounting – $290 (we are now paying a bookkeeper to help out with the books)


Total expenses came out to $69,555.52.


That brings the total profit to $51,937.13.


Of course, to maintain the growth, we would have to keep buying fish oil, but after awhile, we would cap out on sales, and our margins should be a healthy 30% plus. As for March, I didn't spend much on buying tons more inventory as I wanted to show that selling supplements can be profitable.


Conclusion


Overall, the $100,000 challenge was fun, but I wouldn't do it again. It's just too much work with everything I have going on.


It was still a good learning experience. One thing I realized is how much harder it is to rank on Google today compared to 5 years ago. Almost all of my sites are old, so it is much easier for them to rank.


And although NutritionSecrets.com generated good traffic, if it were 5 years ago, the blog would have been at a million visitors a month with the same amount of effort.


So, what do you think of the $100,000 challenge?


Thursday, March 10, 2016

How ClickMechanic Uses Kissmetrics to Grow

When I tell others my company grew its conversions by 20% month on month, they usually ask me two things: “What should I track? And how often should I track it?”


Like all great advice, the answer is simple: it depends. But, the answer is most certainly not to track everything. Because when you track everything, you actually optimise nothing at all.


Our company ClickMechanic is an online marketplace where you can book a mechanic to repair or service your car. So we’ve found the health of our business relies on three KPIs:


  1. Conversion rate

  2. Customer acquisition cost

  3. Lifetime value


If you can make a decent margin on a customer’s first transaction, then you need to understand how that plays out in the LTV of a typical customer. If the cost to acquire that customer is relatively low–AND if these customers purchase from you repeatedly–then you’re going to have a healthy business.


But if you have a high acquisition cost and you’re not making any margins on the first transaction and/or your customers leave after the first transaction, you’re going to find yourself in trouble.


Like most startup founders we meet, we use Kissmetrics for funnel analysis and understanding our customer lifecycles. We use Google Analytics to see a snapshot of our top trends.


How often we track these metrics (hint: it’s not every week)


Every business is different. Ultimately, it’s up to you to experiment and find a system that works for you.


Here’s what our 3-part system looks like:


  1. We review our KPIs every 10 days–the beginning, middle and end of the month. This 10-day check involves someone from sales, customer experience and marketing.

  2. We have individual meetings with each of the key areas where we can drill down, stemming from these 10-day check ins.

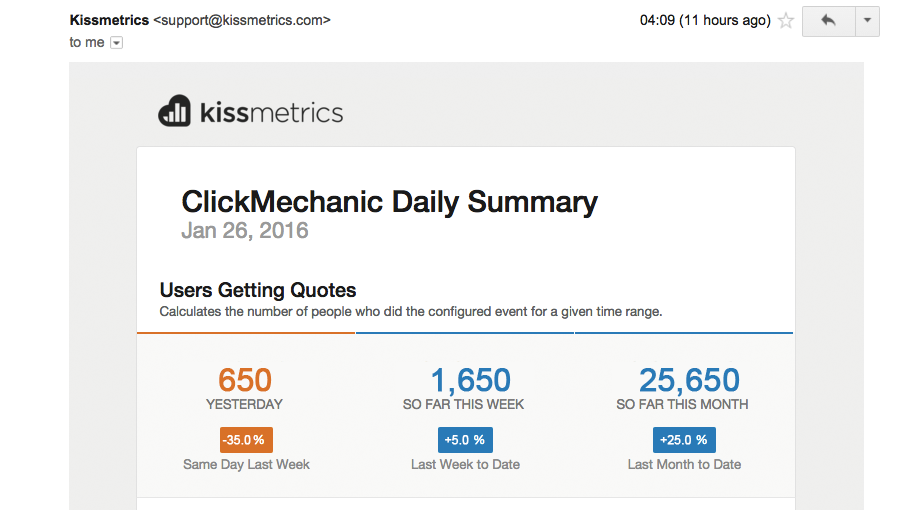
  3. And of course, I always talk w/ my co-founder constantly about these KPIs. This isn’t a set calendar meeting. It’s something we endlessly enjoy talking about, thanks to our daily summary emailed to us every day:


clickmechanic-kissmetrics-email-summary


In our 10-day check in, we look for spikes in acquisition costs, dips in conversion, and dig down into what might have caused that. That allows us to keep track of our targets.


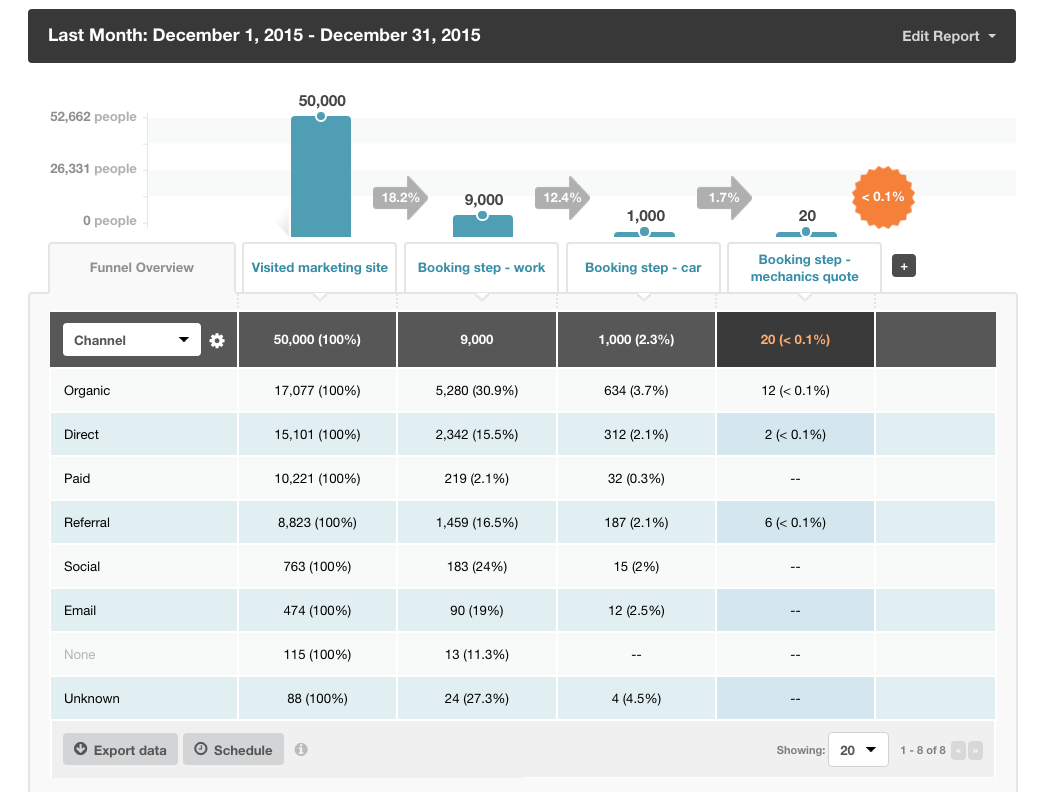
For example, we’ll look into dips in conversion in the Funnel Report:


clickmechanic-kissmetrics-funnel


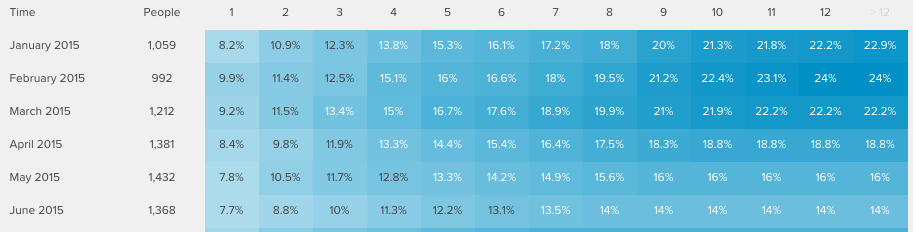
Or, for us to see if our customers are returning customers, we look at the Cohort Report:


clickmechanic-cohort-report-kissmetrics


Why every 10 days? If we can see 10 days in that we’re 5% down on what our run rate needs to be the month, then we know we have to find different ways to get our conversion back up.


In these meetings, we’ll ask:


  • What’s hurting us? Is it conversion?

  • Is it a particular channel?

  • Are the landing pages in paid search performing well?

  • Is a particular product not converting well? Do we need to review the copy?

  • How do we fix it?


We used to analyse our data monthly, but it’s not enough! Once the month is finished, it’s too late once you have those insights to hit your target.


So the secret to this growth story isn’t a secret at all. For us it boils down to: 1) knowing our customers inside and out, 2) being able to dig into the data to answer our questions (and take action!), and 3) sticking to a 3-part system that works for us.


Free Webinar


Signup for the webinar recording to see the other ways ClickMechanic uses Kissmetrics to grow their business.


Monday, March 7, 2016

Be Bold: 4 Uncommon Types of Content That Attract Hundreds of Backlinks

links


If you want great backlinks in the modern SEO world, you need great content.


It’s as simple as that.


Those links improve your search engine rankings and send you droves of referral traffic.


Really, all the posts you read on content marketing come down to two things:


  • how to create great content

  • how to promote it


They can both get pretty complex when you dive into them.


Here, I want to focus on the first point.


Specifically, I want to talk about what types of content outperform all others.


I get hundreds of emails a day from bloggers asking for links to their latest “epic” guide.


I check out as many as I can, but most aren’t nearly as epic as the creators believe they are. In fact, they’re all almost identical.


If you want to be successful with your promotional efforts, you need to have something truly worth promoting.


That means you have something that’s unique, special, and valuable. And it needs to be something that people care about.


It’s no easy feat, but that’s your goal.


Out of those emails I get every day, 99% contain links to your standard blog post/guide type of content.


I love blogging—I really do—but if you want to stand out, you should also consider creating other forms of content.


There are four in particular that are really effective, and I’ll reveal what they are in this post.


Be warned, though: the reason why these types of content aren’t produced as much as others is because they are much more difficult to create than your standard blog posts.


They will cost much more time and money to produce, but they will also produce exponentially more links and revenue.


They’re not for the lazy, but if you’re ready to put in some work, let’s get started. 


Type #1: Tools rule in terms of value


It’s tough to define what a member of your audience would deem valuable, but it correlates with the usefulness of your offer to them.


Blog posts can be very valuable if they help a reader overcome a big problem.


This very post could be worth tens of thousands of dollars to you if you actually implement the advice. I’d say that’s valuable.


But many blog posts aren’t actionable even if they’re well written.


On the other hand, tools are almost always useful because they have a specific purpose and use.


How many bloggers or businesses do you know that have created tools for their audiences?


My guess? Not many.


Not only are such tools useful but they are also rare, which makes them even more special.


Let’s look at a few so you have a clear picture of what I’m talking about.


Take a look at the tool from Keywordtool.io:


image06


This was made back in May of 2014.


According to Ahrefs, at the time of writing, it had over 25,700 backlinks, coming from 3,860 linking root domains.


Can you imagine getting this many links from a series of blog posts, no matter how “epic”?


This keyword tool takes a simple concept, but it executes it well. You enter a keyword into the text box, and the tool will generate a list of keyword suggestions based on autocomplete suggestions.


Basically, it goes to sources such as Google, enters your keyword, and then looks at the suggestions that pop up.


image00


If you hire a typical developer, this kind of a tool would take about 2-3 weeks to create and cost around $5,000 (my estimate).


Based on that cost, the creator has been able to get links for 19.4 cents a piece. Or, in terms of linking root domains (LRDs), it’s $1.75 per linking root domain.


And these aren’t low quality links. On top of that, I’m sure he’s been able to sell a good number of premium memberships (a few extra features), while also drumming up some advanced keyword research projects for other businesses.


One more example (a personal one…): If you go to the Quick Sprout homepage, you’ll see the Quick Sprout tool, which you may or may not know about.


It takes your domain name and generates an incredibly detailed SEO and site performance report:


image07


It wasn’t cheap to make. In fact, it cost me over $100,000.


I include it here to illustrate that you can go as big or as small as you’d like with tools.


Small tools that cost a few hundred or thousand can still get a great amount of attention, but bigger tools usually get more.


Even though the tool is free, the leads that it has generated have already produced several times what I paid to have it created.


That’s the most important conclusion here: Tools can be used not only to get backlinks and traffic but to also produce revenue.


Blog posts convert at lower rates, and while they can produce a solid return on investment (ROI), it doesn’t compare to tools.


Are tools perfect? It’s only fair that I tell you about the potential downside of tools as well.


First is the potentially high cost. You’ll need to invest quite a bit before you ever see returns.


Secondly, results are never guaranteed. Not all tools are well received or popular, so you risk creating a tool that your audience doesn’t love.


However, if you really understand your audience and apply lean marketing principles, you can reduce the risk of this considerably.


Type #2: Viral story videos (almost commercials)


I think many people forget that videos and commercials are still a form of content.


Yes, people don’t like most commercials they see on TV, but smart marketers have figured out that there are certain types of ads that people love.


They’ll share these, link to them, and help them go viral.


My favorite example of this is Dollar Shave Club’s ad campaign.


Their first video came out of nowhere and was enough to establish the company as a household name:


image04


This wasn’t a typical commercial about shaving blades, with all sorts of close-ups. You know the ones I’m talking about…


image05


Instead, it’s an immensely entertaining video starring the founder.


They don’t include the standard platitudes that viewers are sick of hearing. Instead, they’re authentic.


I strongly encourage you to watch the full video now, before moving forward:


This video alone has received almost 22 million views along with 9,520 backlinks from 1,760 domains:


image08


It’s true, creating a video like this isn’t cheap.


It will cost tens of thousands of dollars, and that’s why most businesses don’t even attempt it.


However, if you have the budget, it’s a great option. Just remember to also budget for the initial promotion (that hopefully pushes the video viral).


Type #3: High quality images are more valuable than ever before


I’m not sure why this idea did not take off in the past.


It’s not new.


The strategy is to create a whole bunch of custom images that bloggers in your niche would love to use.


Once you do, you let them know about the images and say they can use any of them free as long as they link back to your site, giving it credit.


If you’re a blogger, you know how hard it is to find great custom images, let alone free.


That’s why this is such an easy sell.


But now, I think this strategy is more effective than ever before.


There have never been more bloggers creating content on a regular basis. That’s one factor that raises the demand for images.


Additionally, most of those bloggers are realizing that quality is the most important factor in their success. That applies to both their writing and the images they use. This creates even more demand for high quality images.


If you can provide that, you will be successful.


Stock images suck, go for custom: There are tons of free stock image sites out there with the same old pictures of models dressed up, faking some pose.


There’s a reason why readers hate these: they look fake and unrelated to the content.


You could customize those stock images, but that’s more work than most bloggers are willing to put in.


Your best bet, when using this strategy, is to create a ton of custom images relevant to the topics that bloggers in your niche write about.


Here’s an example of one that I used on one of my past posts:


image02


As you can see, it doesn’t necessarily have to be complex to look nice and enhance the content.


Take image building a step further and make images for stats: One specific approach you could take is to create images, essentially mini-infographics, that summarize important industry stats.


This approach has one huge bonus.


Think about a time when a blogger is searching for a good stat to use.


They head to Google and search for something like:


content marketing challenges stats


A good portion of the time, they will look for good images to include with the stats they find (I know I do):


image03


If they see a good one, they’ll click on it and go through to the page that hosts it:


image01


In this case, that page would be your gallery.


As long as you ask nicely for a link in exchange for the picture, you’ll usually get it.


The big benefit is that it’s easier to rank in image searches than regular results.


On top of the links you get from emailing specific bloggers, you’ll get links naturally from people who find your image gallery through this process.


But don’t rely on image traffic: If you want to control your ROI from this project, you need to promote your gallery to bloggers yourself.


Make as big of a list of bloggers as possible, and start emailing them with a message like this:


Subject: I made a free gallery of custom (niche) images


Hi (name),


I know that it’s tough to find or create great images to use in blog posts, so I thought I’d do something for the (niche) community.


I’ve hired a designer to create a ton of custom images, some of which will probably be perfect for future posts you write. (I can’t use them all myself!)


The only catch is that I’d appreciate a link back to the gallery when you use a picture.


I’ll also be removing each picture once it’s used a few times so that none of them become too common.


If that sounds like something you’re interested in, let me know, and I’ll send you the link.


Cheers,


(Your name)


Type #4: Stats will drive the future


The final type of content that isn’t created as often as it could be is a list of stats.


Good bloggers love stats and will link to a source when they use a particular statistic in their content.


If you collect a ton of stats on different topics in your niche, they will often link to your page as a reference (on top of the original research studies).


For example, in a health niche, you could create stats for things like:


  • junk food consumption in 2016

  • average amount of protein in diets of different countries

  • number of vegans in 2016 (or over the years)

  • average minutes of exercise that people get per day


Think of stats that bloggers will be looking for.


To make it even more effective, conduct original research: The real power comes when you conduct your own surveys and data analyses.


Then, when a blogger wants to cite a stat from that research, they will link back to your site every single time.


You can easily get hundreds of links (or many more) if your research provides a useful, interesting result.


One business who does this sort of thing is Buzzsumo.


You may remember them because I wrote a post that summarized their research on over 1 billion Facebook posts.


Since they emailed me their findings directly, I didn’t link back to a specific page on their site. Instead, I just linked to their homepage multiple times, which is even better for them.


While I can’t say exactly how many links that research got them, I can confidently say that it’s in the thousands by now.


That kind of research is difficult, but if you’re willing to put in the effort (and maybe hire a data scientist/programmer), it’s possible.


Conclusion


I warned you, none of these content types are easy to produce—that’s why they’re not common.


However, they all can produce tremendous ROIs.


When done right, each of these types of content can attract hundreds (or thousands) of links and lead to greater profits.


I realize they’re not simple to do, so if you need some guidance, let me know where you’re stuck by leaving a comment below.


Monday, February 22, 2016

8 Tools That Will Help You Get Inside Your Readers Heads

head


Do you hate the phrase getting inside your readers head?


Althoughyou know you are supposed to be able to do it, you dont haveany specific instructions onhow to do it.


Of course, its important to understand your currentreaders and those you are trying to attract with your content, but thats one of the hardest skills you have to develop as a writer.


Its going to take years of continuous improvement to become really good at it.


However, there are ways for you to get thisinformation much soonernamely, formulas and tools.


In this post, Im going to focus on the latter.


Ive put together a list of the eight best tools for getting inside your readers heads.


They will give you tangible data you can use to produce content that resonates with your readers.


Finally, Ill show you how to use the key features of these tools. I promise that none of them are difficult to use and that they are worth your time.


Tool type #1 Hard demographics data


If you want to know what your readers think, you first need to know who they are.


Thats where demographics come in.


Essentially, any statistic that describes a characteristic of your audience is a demographic. The most common are:


  • age

  • location

  • device preference

  • gender

  • marital status


The tools in this section will help you figure out who you should be targeting in the first place. They can be used whether you have an existing audience or are just starting off.


1. Demographics Pro for Hootsuite


This tool is one of the most complete Ive ever come across when it comes to demographics.


The only significant limitation is that it draws its data from Twitter.


However, as long as people in your niche use Twitter (which is likely), its really useful.


While you can sign up for Demographics Pro directly, its pretty simple to use this Hootsuite app.


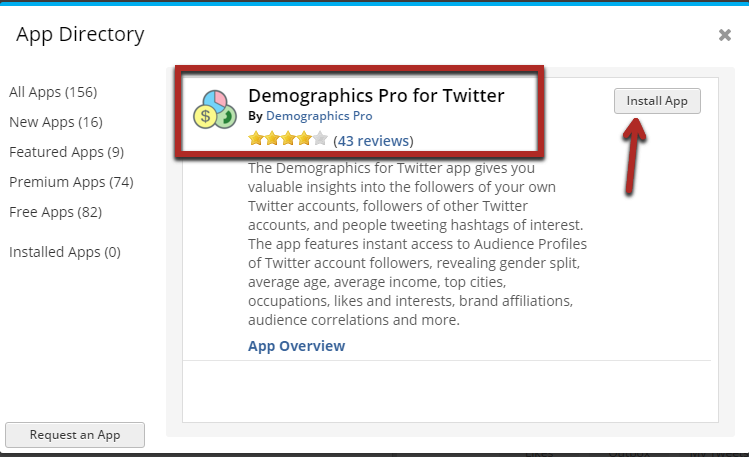
When you click the link in the title for this tool and then click the Install App button on the page, youll be taken to Hootsuite, where youll see a pop-up like this (if youre signed in):


image04


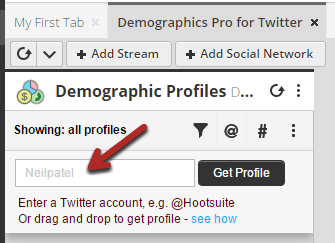
Once you install the app, youll see a new tab on your account called Demographics Pro for Twitter.


image03


To use the tool, simply enter a Twitter handle (e.g., @NeilPatel), and click get profile.


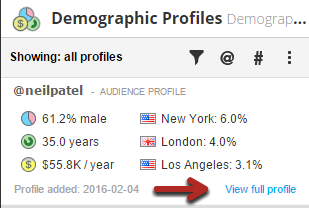
Thatll automatically bring up some basic data:


image15


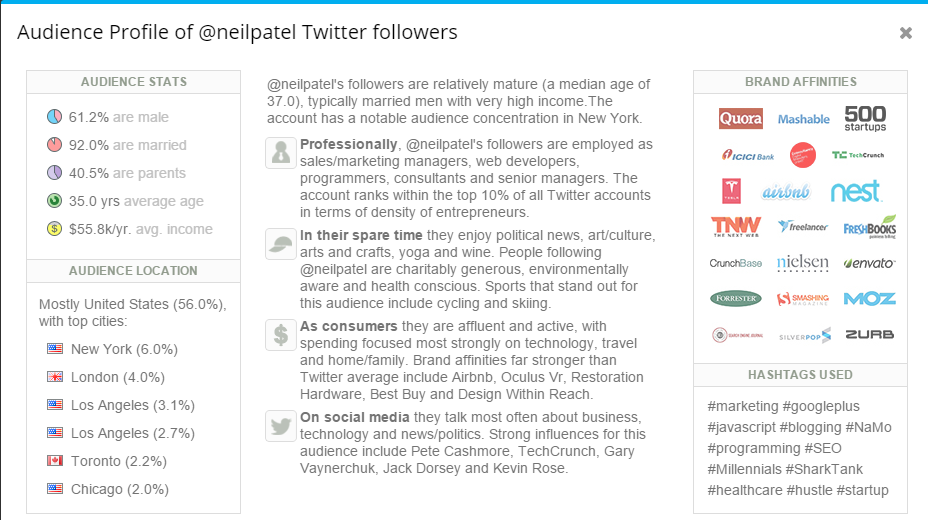
More useful, though, is the view full profile option. Click that link, and youll see an extremely detailed panel like this:


image11


From this, you can get a ton of demographic information about your (or their) followers and even some psychographics (more on that in section 2):


  • gender distribution

  • marital status

  • parental status

  • age

  • average income

  • location

  • types of jobs they have

  • types of hobbies they have

  • types of brands they like


Its a gold mine of information.


If youre already using Twitter, start with your own profile.


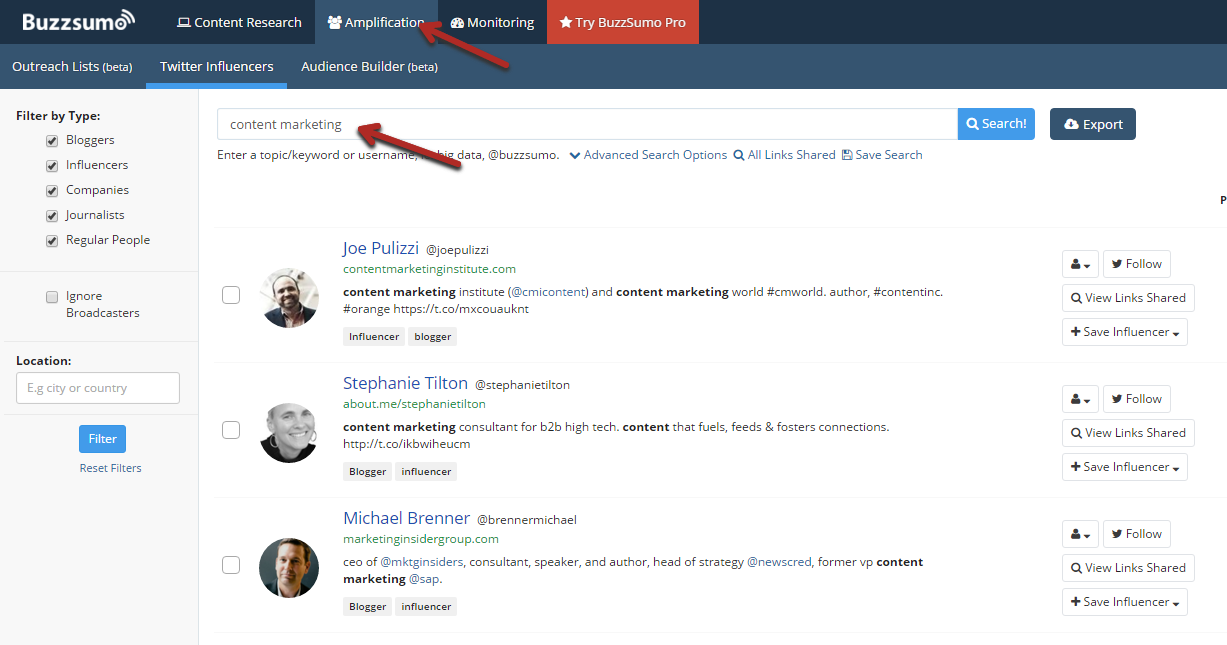
Then, get the stats of some of your top competitors. If you dont know who they are, head to Buzzsumos amplification tool, and search for some keywords that describe your niche:


image05


2. Sprout Social


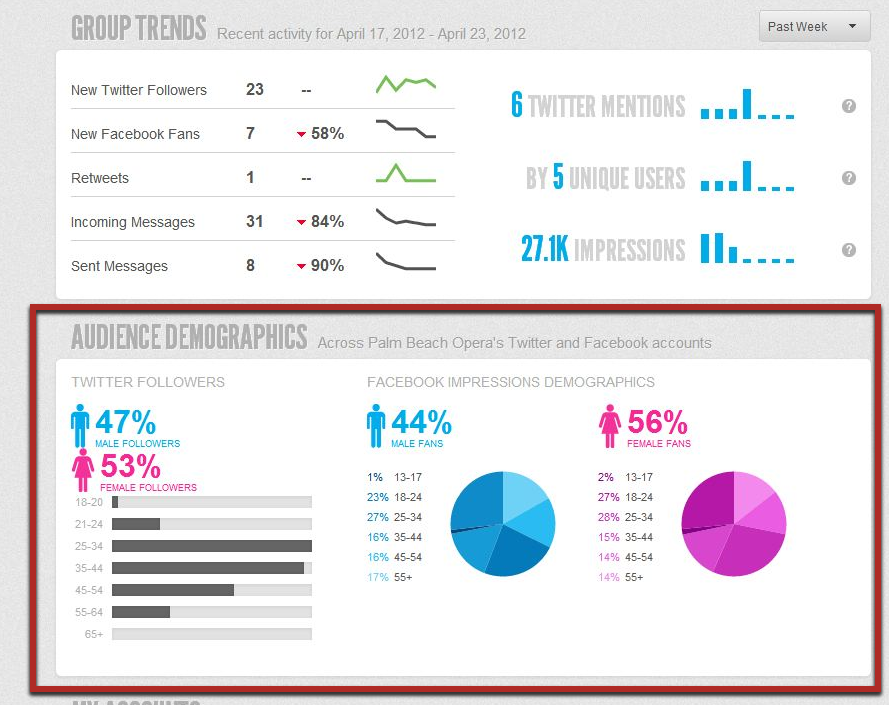
This is a similar type of social audience analyzer. However, it analyzes both Facebook and Twitter, so theres a potential to get a few different insights.


Once you sign up for an account (free trials available), you can connect your Twitter and Facebook accounts (only your own).


That will populate your account with a bunch of social trends data, but more importantlydemographics.


image13


On top of getting a gender distribution of the audience on each platform, you get a detailed breakdown of their age brackets. Thats another important insight into your audience that will come in andy.


3. Google Display Planner


It might surprise you to find out that the Google Display Planner is another decent source ofdemographic dataeven though itisnt the tools primary purpose.


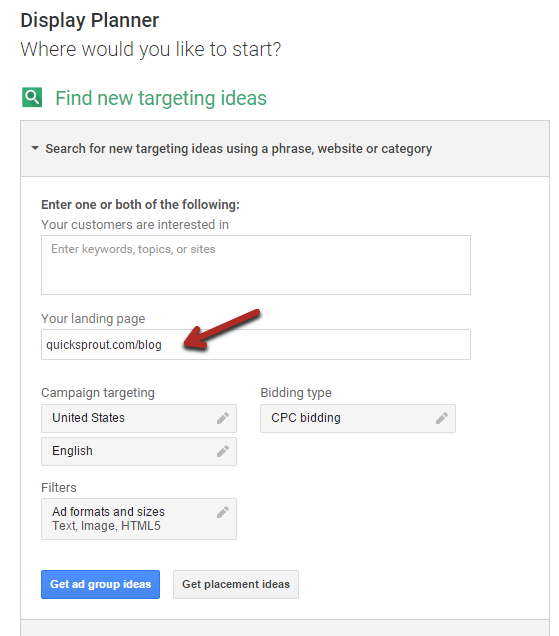
When you open the planner, you have two options for searching:


  • keywords, topics, or sites

  • a landing page


I recommend doing both, and several times if possible. The larger your sample size, the more accurate your demographics data will be.


You can enter your own site, a competitors site, orkeywords that you will be targeting with SEO.


Once youve picked an option, click the blue button to proceed:


image06


On the next page, youll get a whole bunch of suggestions for ad keywords. Ignore them.


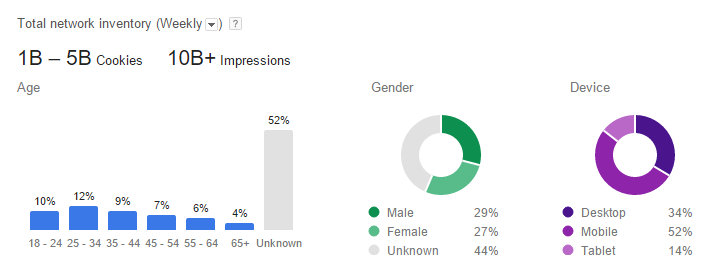
The only thing we care about here is the panel in the center of the screen that breaks down the demographics of people who search for the terms you entered (or terms found on the page you entered).


It looks like this:


image00


Again, you get a gender and age breakdown.


Additionally, you can record which devices that audience prefers to use.


Is all this information redundant? It is to a degree, but its still useful. By now, you have demographic data from three different tools.


That data may look the same, but there may be differences because its collected from different sources.


Having data from multiple sources ensures that it wont be skewed. You can take an average of all the data you collect or keep it as a range (i.e., average age might be 25-34 and not just one specific number).


4. FollowerWonk


The final tool in this section also uses Twitter to retrievedemographic data. However, it provides one important feature that the others miss.


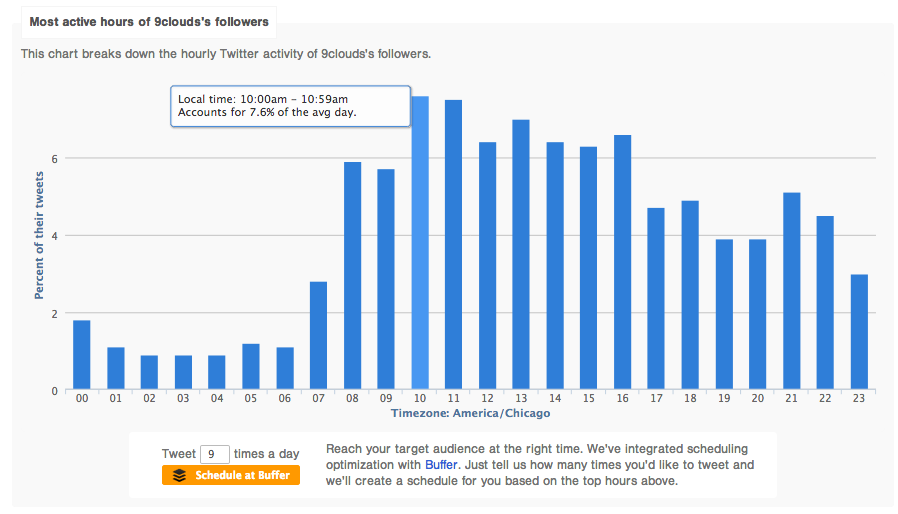
Once you create an account, go to the Analyze tab on the top menu. Enter your Twitter handle, and let the tool scan your followers.


On the next page, look for a graph like the one below that shows at what times your followers are most active.


image10


This information will be useful when you are promoting your content, especially on social media.


Tool type #2 Understand your readers thinking (psychographics)


Once youve nailed down who your readers are or will be, its time to start figuring out how they think.


Ideally, you want to answer questions such as:


  • what are their biggest problems?

  • what type of content do they like the most?

  • what kind of language do they use?
  • what bores them, and what excites them?

The tools in this section will help you answer these questions and eliminateguesswork.


5. Faqfox


This is a simple tool that makes getting useful data from forums easy.


Basically, you enter a keyword and sites to scan, and the tool pulls up relevant thread titles for you. You can search multiple sites at once.


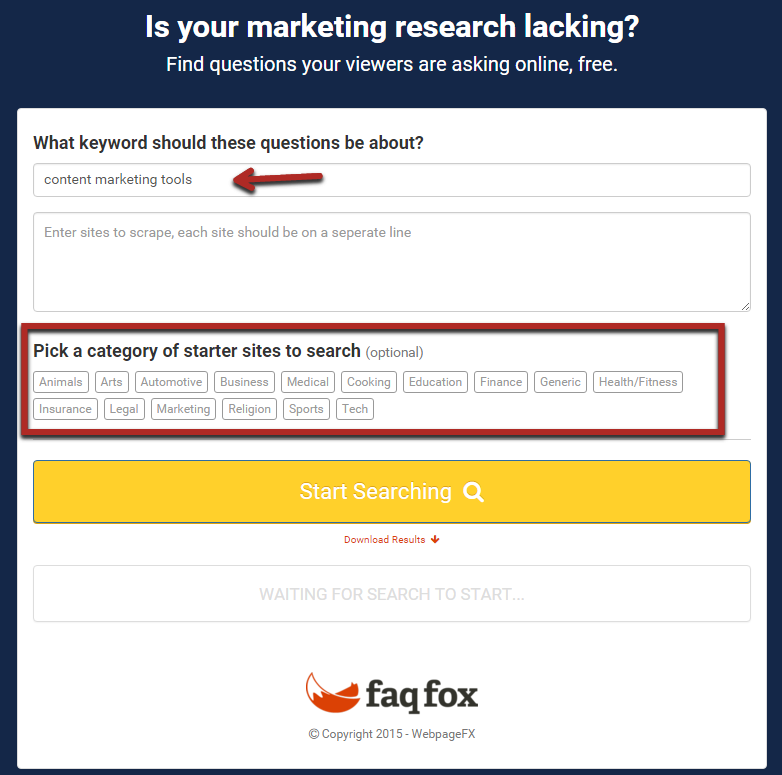
Start by inputting a keyword into the first field. You could manually enter sites, but an easier option is to simply pick one of the preset categories. If youre not sure which one to choose, pick generic:


image09


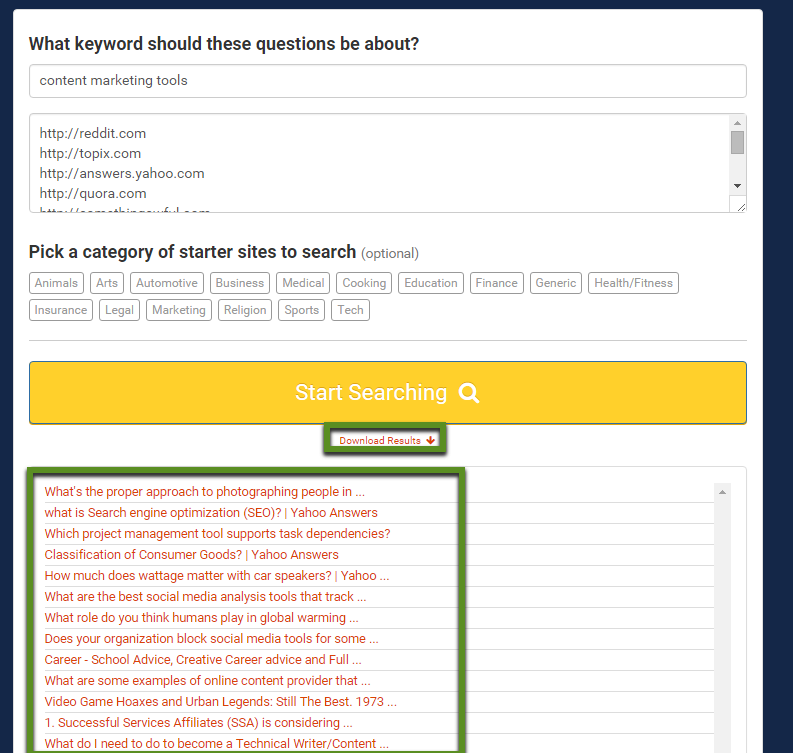
The tool will load the results after a few seconds of search:


image01


I recommend downloading the results into a spreadsheet and analyzing them there.


Remember those questions you need to answer? These results will help you do that.


Youll have some irrelevant results, so start by removing those.


Once you have a few hundred relevant threads left, dig in.


Note down:


  • common questions (those thatcome up more than once)

  • any phrasing that you wouldnt normally use yourself

  • any other keywords that you havent thought of (that you see in the titles)


Then, repeat this whole process at least a few times with different keywords.


6. Crazy Egg


If you know me well, you know I founded Crazy Egg.


Ill let you judge the tool for yourself, but it can be incredibly useful for understanding the behavior of your readers.


The one catch is that you have to actually have readers before you can use the tool.


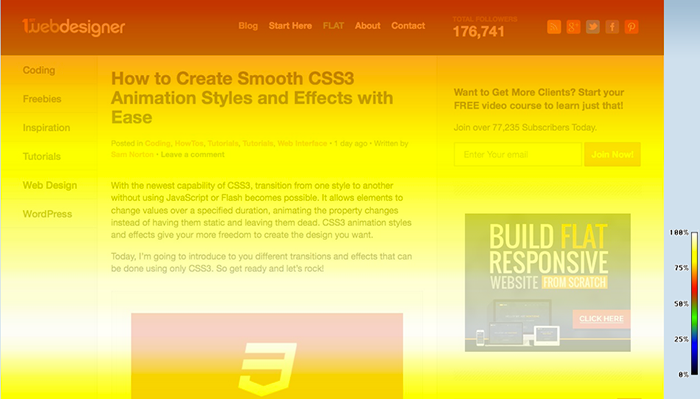
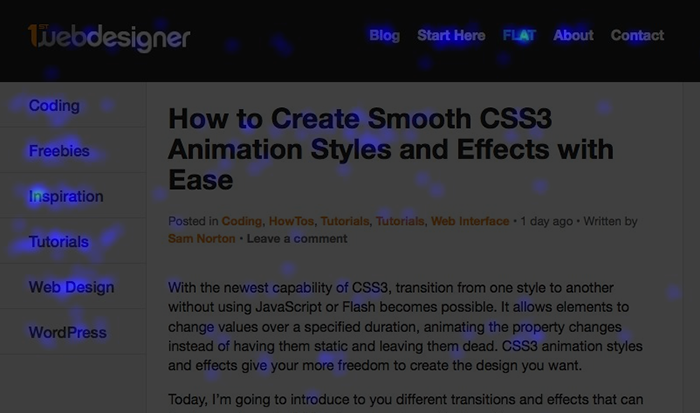
Assuming you do, Crazy Egg will give you a variety of heatmaps that will show you exactly how readers interact with your content.


There are two types of maps youll want to look at.


First is the scroll map, which tells you how people scroll through your page. You can tell what portions of the page they pay more or less attention to.


image08


Its natural for the percentage to decline asyou scroll down, but you might seethat it declines at certain sections in the middle of the content.


This is a clear indication that something on your page didnt interest your readers.


For example, if I looked at a heatmap for this post and saw that theres a huge drop off withinthis section, I could conclude that my readers dont like reading about heatmap tools (or potentially about psychographics).


Similarly, hot spots lower down the page indicate that youve touched upon something that excites them.


Record this information forall your content, and youll start seeing patterns in the type of content,the tone, and the formatyour readerslike.


To get even more insight into your readers preferences, you can use click heatmaps, which show you what readers clicked on:


image12


Youll see that certain things attract their attention more than others. Again, look for patterns.


7. Buzzsumos Top Content Tool


The heatmaps can give you a lot of insight into what excites and bores your readers.


However, sometimes you need more, or you dont have enough readers to use heatmaps yet.


Thats where Buzzsumos top content tool comes in.


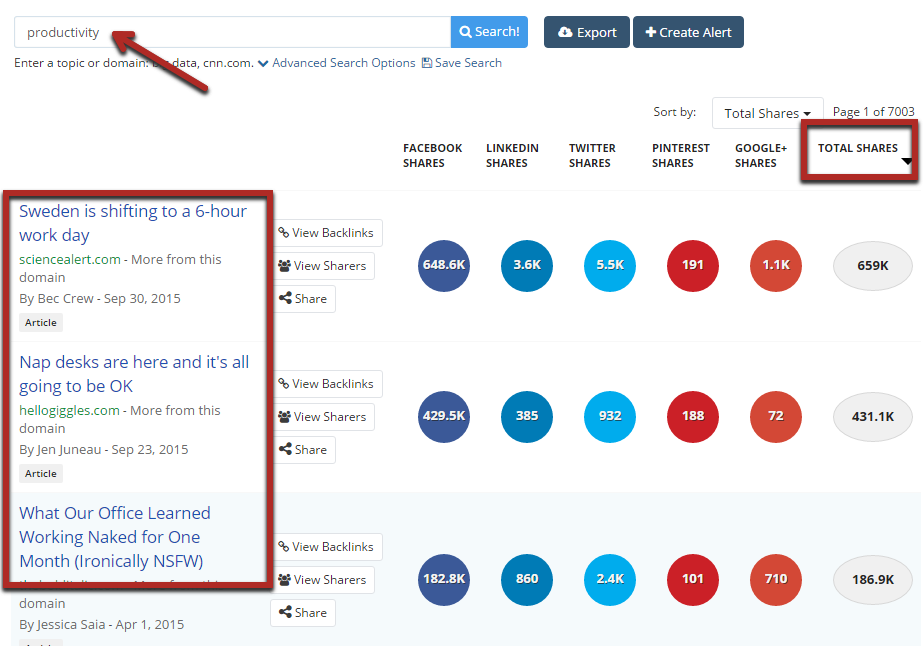
Youll want to make a list of keywords youll be using within your content. Then, search them one by one in the tool:


image14


The tool will return a list of the most popular content in the past year (sorted by total shares).


Visit as many of these pagesas you can, and record down the answers to these questions in your spreadsheet:


  • What format does the content use? (lots of images? videos? big font? small font?)

  • What tone does the content use? (news articles? personal stories? conversational?)

  • Why would your reader be so excited about this topic?


You can leave the last one blank for now if you dont know, but come back to it later.


When you have a good understanding of your readers, you should be able to figure out why these top articles would appeal to them more than the average content.


Finally, searchall theanswers to all those questions for patterns.


For example, if a large chunk of the most popular posts are mainly image-based, you know that your readers love images.


Tool type #3 Assemble your data, and make it useful


If youve used every tool up until this point, you have a lot of useful data.


Dont justputit on a spreadsheet and forget about it.


Instead, create reader personas. Itwill help you and your team when you need to be remindedfor whom you are writing.


I created this final section for a single tool because I feel thatalthough it is a small step you need to takeits a very important step.


8. Make My Persona


This tool was created by Hubspot, and its brilliant.


It guides you through a simple process that uses allthe different demographic and psychographic information youve collected with all the other tools.


It also ensures that you dont forget any key part of creating a reader persona, e.g.,putting a real name or face to it:


image02


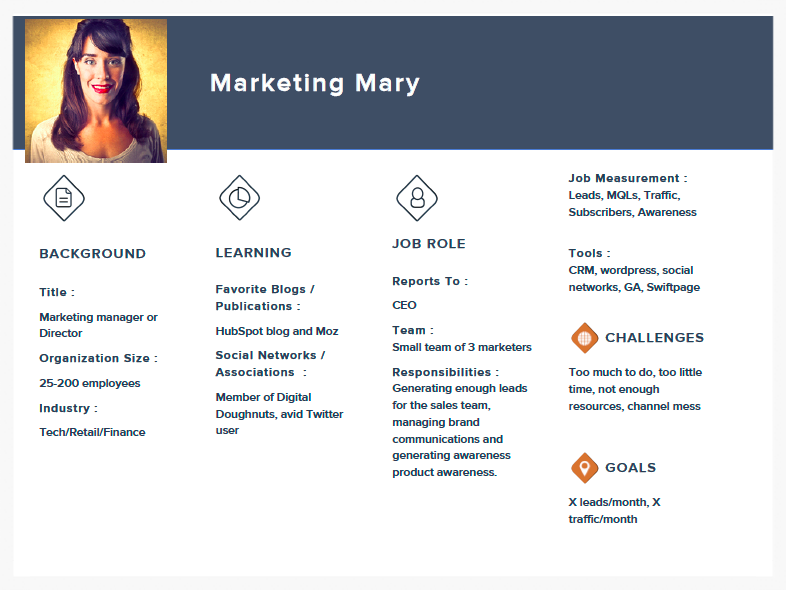
Once you answer all the questions, the tool will producea well-organized persona summary:


image07


First, you should share this with everyone whohelps you with content.


Next, you should be looking at this before you write any content yourself. Always ask yourself what this person would find valuable and interesting. Print it out, and hang it up if you need to.


Note that you can create multiple personas if thats what the data supports.


Conclusion


This is not a huge list, but every tool on this list can be useful.


The better you understand your readers, the more youll be able to write exactly what they want to see (and value).


I recommend trying at least a few of the tools, but if you really want to get a clear picture of what your readers think and care about, use them all.


If I missed a tool that can help writers understand their audiences, please post it in the comments below, and Ill give it a look.


Monday, February 15, 2016

Swiss man takes a world tour on solar powered electric bike


style="display:inline-block;width:250px;height:250px"
data-ad-client="ca-pub-7815236958543991"
data-ad-slot="8717335615">


Swiss cyclist David Brandenberger, 46, who is venturing to the far corners of the planet with his custom sunlight based fueled bike, has taken a stop in Manisa, a city in Turkey's Aegean territory.


Brandenberger told nearby media that he outlined a four meter long trailer, kept money with sun oriented boards, at the back of his three wheeled bike to venture to the far corners of the planet while as yet moderating the earth along.


The protracted trailer empowers him to convey a guitar alongside photography gear.


Amid his endeavor, started July a year ago, Brandenberger will take after the noteworthy Silk Road system to China, predicting his trip to last around 10 years.


Brandenberger, having ventured out 8,000km to date, said the most huge issue of his trip is finding a parking space with his five meter long bike.


"My actual job is opticianry, but the idea of travelling the world makes me very happy", he said.


Source : TRTWorld, yenisafak.